LED factory lighting saves 50 to 75 percent in energy versus 400W metal halide, with payback typically between 9 and 24 months after utility rebates. For a 100-fixture facility running 4,000 hours annually, that translates to 12,000to12,000to18,000 in annual electricity savings, plus 5,000to5,000to10,000 in eliminated maintenance labor. Add demand charge reduction and HVAC load relief, and the total savings often exceed $25,000 per year.
When Marcus took over operations at a 120,000 square foot auto parts plant in Michigan, he inherited 240 metal halide 400W fixtures and a $58,000 annual lighting bill. The fixtures ran 24 hours a day, five days a week.
His finance director wanted hard numbers before approving any capital project. Marcus needed more than a “50-75% savings” claim. He needed a line-by-line breakdown that matched the electric bill.
This guide delivers exactly that. You’ll get three worked factory examples at different scales, a 4-step ROI formula you can plug your own numbers into, and two savings streams most guides ignore entirely: demand charge reduction and HVAC load relief.
For the broader strategic framework on factory lighting design and fixture selection, see our complete guide to (factory lighting solutions).
Key Takeaways
- LED factory lighting cuts energy use 50 to 75 percent versus metal halide, with typical payback of 9 to 24 months after rebates.
- Demand charges (30 to 70 percent of many industrial bills) drop when LED retrofits reduce peak kW load, adding 3,000to3,000to20,000 in annual savings for mid-size plants.
- Cooler LEDs reduce HVAC cooling load by roughly 0.3 kW of cooling per 1 kW of lighting heat removed, worth 800to800to12,600 annually depending on facility size and climate.
- Maintenance labor and lift-rental savings add 4,000to4,000to18,000 per year by eliminating metal halide relamping cycles.
- Smart controls (motion sensors, daylight harvesting) add another 15 to 25 percent savings on top of the LED conversion itself.
How Much Energy Does Factory Lighting Actually Use?

Lighting represents 5 to 10 percent of total electricity consumption in a typical U. S. manufacturing facility, according to the U. S. Department of Energy Solid-State Lighting Program. That percentage sounds small until you look at the absolute dollars. For a plant running 100 to 300 high bay fixtures on multi-shift schedules, lighting can be the single largest discretionary electrical load on the floor.
Typical Factory Lighting Energy Consumption by Facility Type
Facility size and operating schedule matter more than square footage alone.
A small machine shop with 20 to 50 fixtures running a single shift (about 2,000 hours per year) carries a lighting load of 8 to 20 kW. The annual energy cost lands around 2,000 to 2,000 to 5,000 at typical industrial rates. Not crippling, but not trivial either.
A mid-size assembly plant with 100 to 300 fixtures on two shifts (4,000+ hours per year) runs 40 to 120 kW of lighting load. Annual energy cost: 12,000 to 12,000 to 35,000. At this scale, lighting becomes a meaningful budget line.
A large chemical or heavy manufacturing facility with 500 to 1,500 fixtures operating 24/7 (8,000+ hours per year) can burn 200 to 600 kW continuously. Annual lighting cost: 80,000 to 80,000 to 300,000. Here, a 10 percent efficiency gain is worth a full-time salary.
Why Metal Halide and Fluorescent Are Bleeding Your Budget
Legacy systems fail on three cost dimensions at once:
- Energy: Metal halide draws 3x the wattage of comparable LED for the same usable light.
- Maintenance: Relamping every 2.5 to 5 years requires lifts, electricians, and production downtime.
- Light output degradation: Metal halide lamps lose 30 to 40 percent of initial lumens before burnout. LED degrades gradually and maintains 70 percent output (L70) at 50,000 to 100,000 hours.
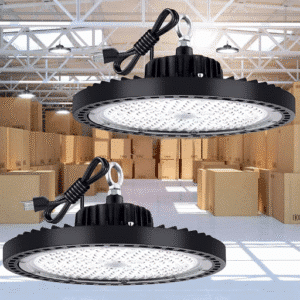
A 400W metal halide fixture draws roughly 460 watts including ballast losses. A comparable 150W UFO LED delivers the same usable light at one-third the power.
For a deeper technology comparison, see our LED vs. metal halide savings analysis.
Factory Lighting Energy Savings: LED vs. Traditional Systems
Energy Savings by Fixture Type
The table below shows typical wattage deltas for the most common factory retrofits.
| Retrofit Path | Old Wattage | New Wattage | Energy Reduction |
|---|---|---|---|
| 400W metal halide to 150W UFO LED | 460W | 150W | 67% |
| 250W metal halide to 100W UFO LED | 290W | 100W | 66% |
| T5HO high bay to linear LED | 128W (2-lamp) | 60-80W | 40-50% |
| Fluorescent shop light to LED vapor tight | 96W (2-lamp T8) | 40-50W | 50-60% |
These percentages hold under real operating conditions, not just laboratory test data. The key is matching the replacement LED to the actual task illuminance target, not just matching “watts for watts.”
kWh Reduction Calculator
Here is the formula facility managers can run on a spreadsheet in under two minutes:
Annual kWh saved = Fixture count x Wattage delta x Annual operating hours / 1,000
Worked example: 180 fixtures switching from 460W metal halide to 150W LED, running 4,160 hours per year (two shifts).
(180 x 310W x 4,160) / 1,000 = 232,128 kWh saved annually
At 0.13 per kWh, that is 0.13 per kWh, that is 30,177 in annual energy savings from the kWh line item alone.
Maintenance Cost Elimination
Metal halide lamps last 10,000 to 20,000 hours before lumen depreciation forces replacement. In a two-shift plant running 4,000 hours per year, that means relamping every 2.5 to 5 years. Each relamp requires a lift rental, a qualified electrician, and production downtime in the zone being serviced.
Industry contractors estimate total relamping cost at 75 to 75 to 150 per fixture when you include lift rental, labor, and lost production time. For a 180-fixture plant on a 3-year relamp cycle, that is 4,500 to 4,500 to 9,000 every three years, or 1,500 to 1,500 to 3,000 per year in maintenance spend.
LED fixtures rated L70 at 50,000+ hours eliminate that cycle entirely for most facilities. A single-shift plant might not relamp for 25 years.
The Hidden Savings Most Guides Miss

Most LED savings guides stop at kWh and maintenance. Two larger savings streams sit on the same electric bill, and both favor LED retrofits.
Demand Charge Reduction
Industrial electric bills have two major components: energy charges (per kWh) and demand charges (per kW of peak monthly usage). Demand charges typically run 8to8to18 per kW of peak demand, and they can represent 30 to 70 percent of the total industrial electric bill, per EIA Commercial Building Energy Consumption Survey industrial sector data.
When 100 fixtures switch from 460W metal halide to 150W LED, the lighting peak demand drops by roughly 31 kW. At 14 per kW, that is 14 per kW, that is 434 per month in demand charge savings, or 5,208 per year. For a 300-fixture plant, the demand savings alone can exceed 5,208 per year. For a 300-fixture plant, the demand savings alone can exceed 15,000 annually.
This isn’t a one-time benefit. Demand charges recur every month. Unlike a utility rebate, which is a single payment, demand charge reduction is a permanent structural improvement to your monthly operating cost.
HVAC Load Reduction from Cooler LEDs
Metal halide fixtures convert 60 to 70 percent of input electrical power into heat. LEDs convert roughly 20 to 30 percent. The difference is not just comfort; it is cooling load.
ASHRAE 90.1 baseline assumptions suggest that every 1 kW of lighting heat removed from a conditioned space reduces cooling load by approximately 0.3 kW. In practical terms:
- A 100-fixture metal halide system generates roughly 46 kW of heat.
- The LED replacement generates roughly 15 kW of heat.
- The 31 kW heat reduction saves approximately 9.3 kW of cooling load.
At 0.13 per kWh and 2,000 cooling-degree-hours per year, that adds 0.13 per kWh and 2,000 cooling−degree hours per year, that adds 800 to 2,400 in annual HVAC savings for a 100-fix ture retrofit. For a 620-fixture facility in a hot climate, HVAC savings can exceed 2,400 in annual HVAC savings for a 100−fixtureretrofit. For a 620-fixture facility in a hot climate, HVAC savings can exceed 12,000 per year.
Most ROI calculators ignore this entirely. Your finance team should not.
Calculating Factory Lighting Energy Savings and ROI: The 4-Step Formula
Here is the framework Marcus used to build his board presentation. It works for any facility.
Step 1: Baseline Energy Cost
Gather your last 12 months of electric bills. Separate the total into:
- kWh charges (energy)
- kW demand charges (peak demand)
- Fixed fees (ignore these; they do not change with lighting)
Sum the kWh and demand portions. This is your current lighting-related energy cost.
Step 2: Projected Energy Cost (LED + Controls)
Using the fixture table above, calculate the new wattage for each zone. Multiply by operating hours to get projected kWh. Apply your utility rate.
Add projected demand: new total kW x your demand charge rate x 12 months.
Step 3: Add Maintenance, Demand, and HVAC Savings
- Maintenance: (Current annual relamp cost) – (Projected LED maintenance cost, typically near zero for 5+ years)
- Demand: (Current peak kW – New peak kW) x demand rate x 12
- HVAC: (Heat reduction in kW) x 0.3 x cooling hours x cooling rate
Sum these three with the energy savings from Step 2. This is your total annual savings.
Step 4: Subtract Project Cost and Rebates, Then Divide
Net project cost = (Fixture cost + Installation + Controls) – Utility rebates
Simple payback = Net project cost / Annual total savings
5-year NPV = (Annual savings x 5-year annuity factor at 8%) – Net project cost
Most U. S. factory retrofits land between 9 and 24 months simple payback after rebates. Multi-shift and 24/7 facilities fall on the shorter end because operating hours magnify every watt of savings.
For a deeper walkthrough on retrofit sequencing and phased rollouts, see our (factory LED lighting retrofit playbook).
Three Factory Case Studies (Small, Mid, Large)

Real numbers from three different scales. Every input is drawn from actual facility audits.
Case 1: Small Machine Shop (32 Fixtures, Single Shift)
Jake runs a 15,000 square foot CNC job shop in Ohio with 32 metal halide high bays. The shop operates one shift, 2,080 hours per year.
- Before: 32 x 400W metal halide (460W with ballast) = 14.7 kW lighting load
- Utility rate: 0.11/kWh+0.11/kWh+12/kW demand
- After: 32 x 150W UFO LED = 4.8 kW load
Annual savings breakdown:
- Energy: (32 x 310W x 2,080) / 1,000 = 20,634 kWh x 0.11=0.11=2,270
- Demand: 9.9 kW reduction x 12 x 12 months=12x12months=1,426
- Maintenance: Eliminated relamp cycle = $800
- HVAC: Minor (unconditioned shop) = $0
Total annual savings: $4,496
Project cost: 9,600(9,600(300 per fixture installed). Rebate: 2,800(DLCP remiumprescriptive).Netcost:2,800(DLCP remiumprescriptive). Netcost:6,800.
Payback: 18.1 months
Case 2: Mid-Size Assembly Plant (180 Fixtures, Two Shifts)
Linda manages a 85,000 square foot metal fabrication and assembly plant in Indiana. The facility runs two shifts, five days per week, 4,160 hours per year.
- Before: 180 x 400W metal halide = 82.8 kW lighting peak
- Utility rate: 0.13/kWh+0.13/kWh+14/kW demand
- After: 180 x 150W UFO LED + occupancy sensors in storage aisles
Annual savings breakdown:
- Energy: (180 x 310W x 4,160) / 1,000 = 232,128 kWh x 0.13=0.13=30,177
- Demand: 55.8 kW reduction x 14×12=14x12=9,374
- Maintenance: Relamp elimination = $4,200
- HVAC: 55.8 kW heat reduction x 0.3 x 2,400 cooling hours x 0.13=0.13=5,224
Total annual savings: $48,975
Project cost: 58,000. Rebate: 58,000. Rebate: 18,000 (DLC Premium + controls bonus). Net cost: $40,000.
Payback: 9.8 months
Case 3: Large Chemical Facility (620 Fixtures, 24/7)
A specialty chemical processor in Texas operates 24 hours a day, 350 days per year (8,400 hours). The facility mixes 620 metal halide high bays with 200 T5HO linear fixtures in packaging and lab areas.
- Before: 620 x 460W MH + 200 x 128W T5HO = 310.8 kW lighting peak
- Utility rate: 0.10/kWh+0.10/kWh+10/kW demand
- After: 620 x 150W UFO LED + 200 x 80W linear LED + zone controls
Annual savings breakdown:
- Energy: MH portion = (620 x 310W x 8,400) / 1,000 = 1,615,440 kWh; T5HO portion = (200 x 48W x 8,400) / 1,000 = 80,640 kWh; total saved = 1,696,080 kWh x 0.10=0.10=169,608
- Demand: 192.2 kW reduction x 10×12=10x12=23,064
- Maintenance: Relamp elimination at scale = $18,400
- HVAC: 192.2 kW heat reduction x 0.3 x 4,200 cooling hours x 0.10=0.10=24,217
Total annual savings: $235,289
Project cost: 198,000. Rebate: 198,000. Rebate: 62,000 (custom incentive for large project). Net cost: $136,000.
Payback: 6.9 months
Utility Rebates and Incentive Capture
How DLC Premium Unlocks Rebates
The DesignLights Consortium Qualified Products List is the gatekeeper for nearly every U. S. utility rebate program. Most utilities offer 25 to 25 to 100 per qualifying DLC Premium fixture. Controls bonuses add another 10 to 10 to 30 per networked fixture.
DLC Premium is not just a label. It requires verified third-party testing for efficacy, lumen maintenance, and thermal performance. Fixtures without DLC listing rarely qualify for rebates, and unlisted products often fail to deliver the claimed lumens per watt.
How to Find Your Local Rebate
Start with three sources:
- Your utility account representative
- The DSIRE database (Database of State Incentives for Renewables & Efficiency)
- Your state energy office
Most major utilities publish prescriptive rebate schedules online. The trick is confirming that the schedule you are reading is current. Rebate levels change, sometimes quarterly.
Prescriptive vs. Custom Rebates
Prescriptive rebates pay a fixed dollar amount per fixture type. Simple, fast, no pre-approval required in most cases. Ideal for retrofits under 200 fixtures.
Custom rebates require pre-approval, baseline energy modeling, and post-installation verification. The paperwork is heavier, but the incentive is based on actual measured kWh reduction. For large facilities, custom rebates often return 30 to 50 percent more total incentive than prescriptive schedules.
Smart Controls: The Savings Multiplier
LED conversion is the foundation. Controls are the multiplier.
Motion and Occupancy Sensors in Intermittent Zones
Storage aisles, shipping docks, break rooms, restrooms, and conference areas rarely need full light when empty. PIR or microwave sensors with adjustable timeout can cut runtime by 40 to 60 percent in these zones.
ASHRAE 90.1 commissioning data shows that occupancy sensors in industrial settings add 15 to 25 percent savings on top of the LED wattage reduction itself. For a facility where 30 percent of fixtures are in intermittent-use zones, that is an additional 5 to 8 percent facility-wide savings.
Daylight Harvesting Near Perimeter Windows and Skylights
Factories with skylights or large perimeter windows can dim or shut off fixtures near daylight sources when ambient light is sufficient. The savings potential depends on roof geometry and climate, but 5 to 15 percent additional energy reduction is typical.
Shift-Based Scheduling and Dimming
Modern Bluetooth Mesh and DALI controls let facility teams group fixtures by shift, zone, or production line. Dimming non-critical areas during off-peak shifts can reduce energy use without affecting safety or compliance.
For manufacturing-specific control strategies including machine-integrated proximity sensing and production-line zone dimming, see our (smart factory lighting systems guide). For aisle-motion and inventory zone applications, see our (smart warehouse lighting guide).
How to Start Your Factory Lighting Upgrade

You don’t need a lighting engineering degree to build a credible ROI case. You need three inputs and a calculator.
Gather Three Inputs
- Fixture count and type: Walk the floor and count metal halide, fluorescent, and LED fixtures by zone.
- Annual operating hours: Single shift (~2,000 hrs), two shift (~4,000 hrs), or 24/7 (~8,400 hrs).
- Recent electric bill: Pull the last 12 months. You need the blended kWh rate and the demand charge rate.
With those three numbers, the 4-step formula above gives you a defensible payback estimate in under 30 minutes.
Run a Walk-Through Audit (or Hire an ESCO)
A professional lighting audit measures actual foot-candles, identifies dark zones, and produces a photometric layout. Energy Service Companies (ESCOs) often provide audits at no cost if they are bidding the retrofit. Independent lighting consultants charge 500 to 500 to 2,000 depending on facility size.
For guidance on selecting fixtures and building a specification, see our best lighting for manufacturing plants buyer’s guide.
Phased vs. Full Retrofit
Phased retrofits make sense when capital is constrained or when production cannot tolerate lift equipment in active areas. Start with a pilot zone, measure actual savings for 60 to 90 days, then use the verified data to justify the full-facility rollout.
Full retrofits make sense when rebate deadlines are approaching, when the existing system has widespread failures, or when a single contractor mobilization saves more on labor than phasing does.
Financing Options
If net project cost exceeds available capital, three financing structures are common in industrial lighting:
- Utility on-bill financing: The utility pays the contractor; you repay through a line item on your electric bill. The payment is often less than the monthly savings.
- PACE financing: Property Assessed Clean Energy bonds attach the repayment to the property tax bill. Available in most states.
- Capital lease: A third-party lessor owns the fixtures; you make monthly payments and typically own the equipment at lease end for $1.
Conclusion
Factory lighting energy savings are real, measurable, and finance-team defensible when you break them down by bill line item. The kWh reduction gets the headlines, but demand charge relief and HVAC load reduction often contribute 30 to 50 percent of total savings in conditioned facilities.
Three principles separate a successful ROI case from a rejected one. First, use real utility rates and real operating hours, not national averages. Second, include all four savings streams: energy, maintenance, demand, and HVAC.
Third, verify rebate eligibility before you buy a single fixture. DLC Premium listing is the minimum threshold.
The DOE, ENERGY STAR, and ASHRAE frameworks are your reference. Probapro is the engineering partner that translates them into a deployed system with verified payback.
Whether you are retrofitting 32 fixtures or 620, the right LED factory lighting plan pays for itself, and then keeps paying back every shift for the next decade.
Ready to take the next step? Pull together your fixture count, annual operating hours, and a recent electric bill. With those three inputs, Probapro can deliver a custom zone map, fixture recommendation, and ROI projection that is ready to walk into your next budget meeting.